About the Project
MoneyGoWhere is a finance application built by my team and I as part of a Software Engineering Project. It was morphed from a basic command line interface Address Book. MoneyGoWhere is a personal finance application targeted at students at the National University of Singapore (NUS). It is designed to help students to keep track of all their spending and their related information such as date, cost and tags. Notable features include allowing users to set budget goals, view statistics, set reminders for bills and export their data to a .csv file.
My Role
My role was to implement the statistics and graph features. The following sections will illustrate these features in greater detail.
Below are a few icons and formatting which will be used in this document.
| Important information that should be noted. |
| Tips that can help you better navigate the application. |
test: Command to be executed or a component, class or object in the architecture of the application.
Additional useful information for this section.
Summary of contributions
This section shows a summary of contributions I have made for the project.
-
Major enhancement: I implemented the statistics feature.
-
What it does: It allows the user to view their spending in the form of a pie-chart which organises the user’s expenditure based on tags.
-
Justification: This feature enhances the product significantly as it enables users to view their spending in the form of figures which is more reader-friendly. Furthermore, it allows users to be more informed of their spending habits as they are now aware of where they have spent most of their money on, enabling them to reflect on their spending habits.
-
Highlights: This enhancement required an in-depth understanding of the software architecture as it involves multiple components of the application.
-
-
Minor enhancement: I implemented the graph feature.
-
What it does: It organises the user’s expenditure based on date, allowing users to view their daily expenditure based on a date range provided.
-
Justification: It enables users to view how much they spend daily and also enable them to analyze trends in their spending amount over a particular period of time. This helps them to better analyze their spending habits.
-
Highlights: This enhancement also required an in-depth understanding of the software architecture as it involves multple components of the application.
-
-
Code contributed: [Collated code]
-
Other contributions:
-
Project management:
-
Helped track issues on the team repository using labels, milestones and project card
-
-
Enhancements to existing features:
-
Documentation:
-
Vetted and formatted the entire User Guide after individual contributions by team members (Pull request #101)
-
Reviewed team member’s documentations (Pull requests #80, #85, #98)
-
Updated Quick Start section and created a set of symbols/legends for User Guide (Pull requests #50, #101)
-
Collated and updated profiles for all members of the team (Pull request #7)
-
Updated Setting Up, Documentation, Testing and DevOps sections of Developer Guide (Pull request #244)
-
-
Community:
-
Contributions to the User Guide
Given below are sections I contributed to the User Guide for the Statistics feature and Graph feature. They showcase my ability to write documentation targeting end-users.
Generating statistics : stats
Organises the spending based on tags. A pie chart is generated, with each sector representing the total amount of money spent on a tag. This enables users to be more informed of their spending habits as they are now aware of where they have spent most of their money on. An example is shown below.
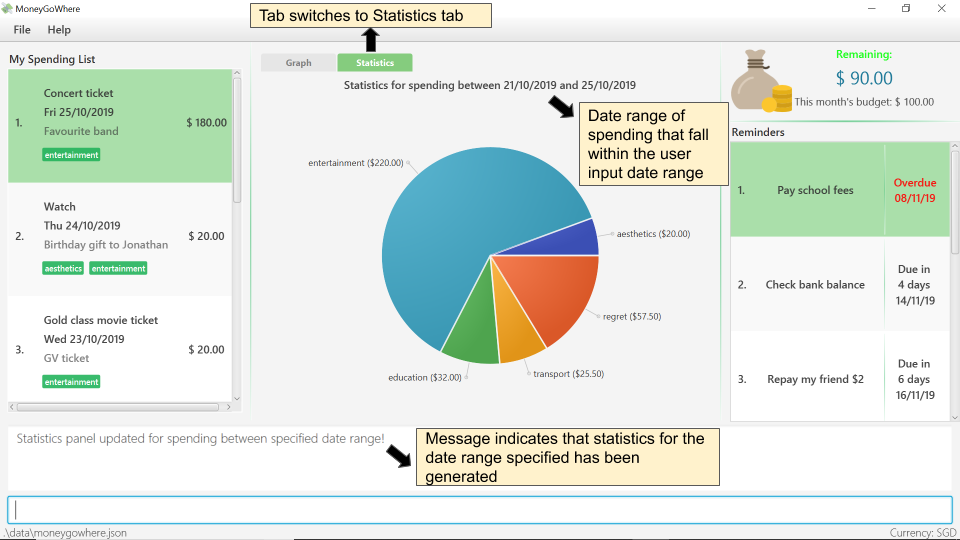
stats d/21/10/2019 d/25/10/2019Format: stats d/DATE_START d/DATE_END
| Spending with multiple tags will be counted more than once in total as the statistics seek to show the user which tag they have spent the most money on. |
| DATE_START must be earlier or the same as DATE_END. |
Date range can be input in the following ways:d/DATE_START d/DATE_ENDd/DATE_START to DATE_ENDd/DATE_START - DATE_END
|
| The statistics panel will update every time the spending list displayed changes. For example, when a new spending with a tag is added, the statistics panel will update the pie chart to show the statistics for all spending, including the new spending. |
| The statistics panel will update with the currency set. |
Examples:
-
stats: Generates statistics for all spending. -
stats d/20/10/2019 d/25/10/2019: Generates statistics for spending between and including 20/10/2019 and 25/10/2019.
Expected Output:
Statistics is shown.
Generating a graph : graph
Organises the spending based on date. A line graph is generated, with each point representing the total amount of money spent on a particular date. This enables users to analyze trends in their spending amount over a particular period of time. An example is shown below.
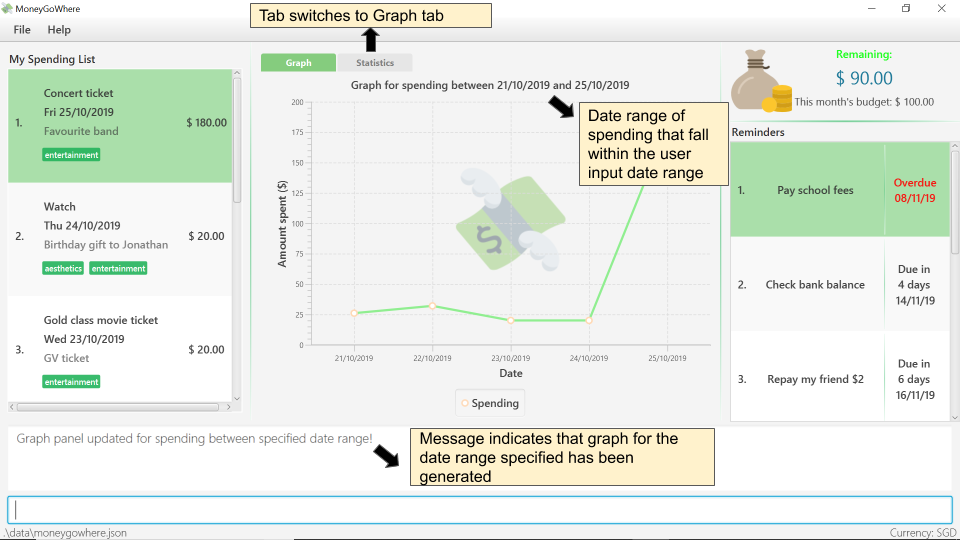
graph d/21/10/2019 d/25/10/2019Format: graph d/DATE_START d/DATE_END
| DATE_START must be earlier or the same as DATE_END. |
Date range can be input in the following ways:d/DATE_START d/DATE_ENDd/DATE_START to DATE_ENDd/DATE_START - DATE_END
|
| Hovering the mouse over a point displays the date and total amount of money spent (to the nearest dollar) on that date. |
| The graph panel will update every time the spending list displayed changes. For example, when a new spending is added, the graph panel will update and generate a graph for all spending, including the new spending. |
| The graph panel will update with the currency set. |
Examples:
-
graph: Generates a graph for all spending. -
graph d/20/10/2019 d/25/10/2019: Generates a graph for spending between and including 20/10/2019 and 25/10/2019.
Expected Output:
A graph is shown.
Contributions to the Developer Guide
Given below are sections on the implementation of the Statistics feature and Graph feature I have worked on. They showcase my ability to write technical documentation and the technical depth of my contributions to the project.
Statistics feature
Current Implementation
For the current statistics feature, there are 2 main commands that the user can execute.
-
stats- display statistics for all spending -
stats d/DATE_START d/DATE_END- display statistics for spending within a date range
The StatsCommandParser differentiates these 2 commands based on whether a valid date range is provided as illustrated in the diagram below.

-
If a valid date range is provided in the
statscommand given by the user,StatsCommand(DATE_START, DATE_END)with the respective date parameters is created. The command will execute based on this date range. -
If no date range is provided by the user,
StatsCommand()is created, which will execute the command based on the whole date range in the list. -
Else, if the parameters are invalid, a
ParseExceptionis thrown and the application waits for a new user input.
The implementation of the Statistics feature can be split into 2 phases, preparation and execution. Given below is an explanation of how the Statistics mechanism behaves at each phase.
Preparation
During the preparation phase, the program parses the command for Statistics and verifies the arguments.
The following sequence diagram shows how stats command works during the preparation phase.

The lifeline for StatsCommandParser should end at the destroy marker (X) but due to a limitation of PlantUML, the lifeline reaches the end of diagram.
|
-
User first enters a
statscommand. -
SpendingBookParserwill parse and identify the command as aStatsCommandand pass on the argument toStatsCommandParser. -
If no arguments were provided by the user,
StatsCommand#StatsCommand()is called to create aStatsCommandwith no parameters. Otherwise,StatsCommandParserwill verify whether the arguments provided were valid.-
If they are valid,
StatsCommand#StatsCommand(DATE_START, DATE_END)is called to create aStatsCommandwith the specified parameters. -
Else, a
ParseExceptionwill be thrown and an error message will be shown to the user.
-
-
StatsCommandis returned toLogicManagerwhich then callsStatsCommand#execute(). -
Model#updateFilteredSpendingList(predicate)is subsequently called to update the list.
Execution
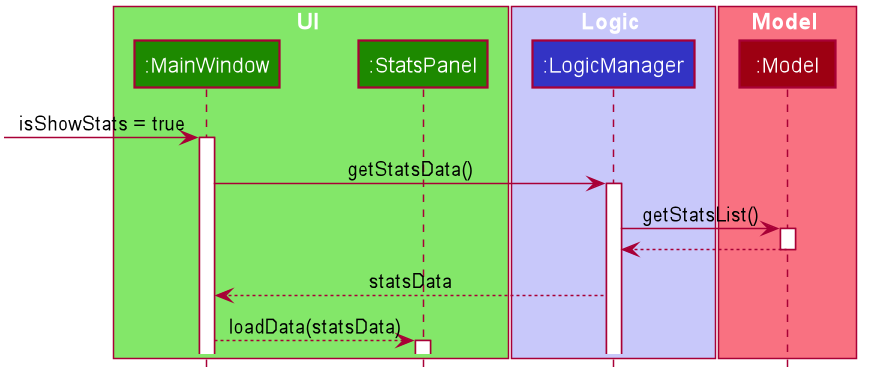
In the execution phase, the program processes and retrieves the data to be displayed and finally displaying it. Below is the UML sequence diagram and a step-by-step explanation.
-
Upon checking that the boolean
isShowStats= true, theMainWindowcallsLogicManager#getStatsData(). -
LogicManagerthen gets the filtered list by callingModel#getStatsList, which returns an unmodifiableObservableList, containing only spending within the specified date range. -
LogicManager#getStatsData()then processes the spending and organise the data into aLinkedHashMap<String, Double>where the key value pairs represents tag and cost respectively. -
Finally, the
statsDatais returned to theMainWindow. The data will be displayed on the Ui throughStatsPanel#loadData(statsData)call.
Design Considerations
| Aspect | Alternative 1 (Current choice) | Alternative 2 |
|---|---|---|
Visual Representation of Statistics |
Represent data in the form of a pie chart. |
Represent data in the form of a table. |
Graph feature
Current Implementation
For the current graph feature, there are 2 main commands that the user can execute.
-
graph- generates graph for all spending -
graph d/DATE_START d/DATE_END- generates graph for spending within a date range
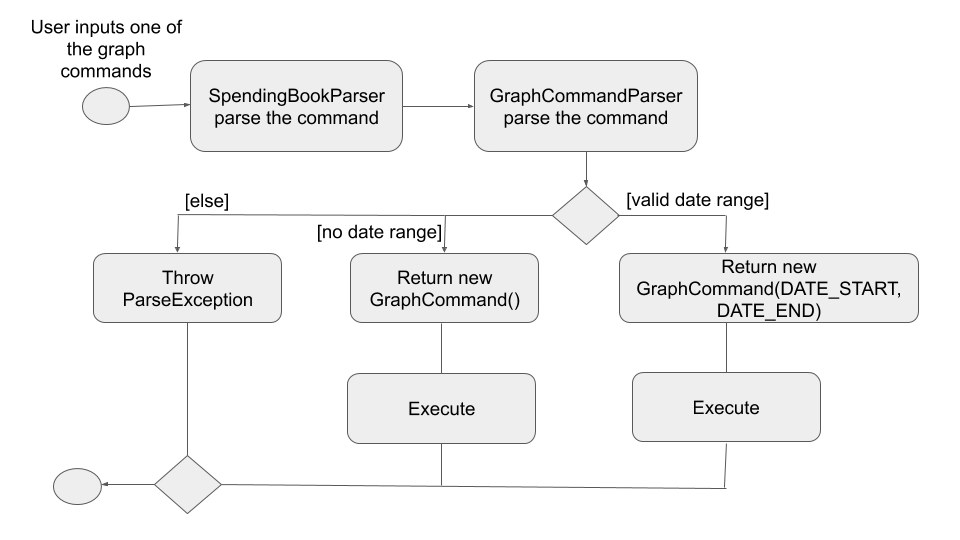
The GraphCommandParser differentiates these 2 commands based on whether a valid date range is provided as illustrated in the diagram below.
-
If a valid date range is provided in the
graphcommand given by the user,GraphCommand(DATE_START, DATE_END)with the respective date parameters is created. The command will execute based on this date range. -
If no date range is provided by the user,
GraphCommand()is created, which will execute the command based on the whole date range in the list. -
Else, if the parameters are invalid, a
ParseExceptionis thrown and the application waits for a new user input.
The implementation of the Graph feature can be split into 2 phases, preparation and execution. Given below is an explanation of how the Graph mechanism behaves at each phase.
Preparation
During the preparation phase, the program parses the command for Graph and verifies the arguments.
The following sequence diagram shows how graph command works during the preparation phase.
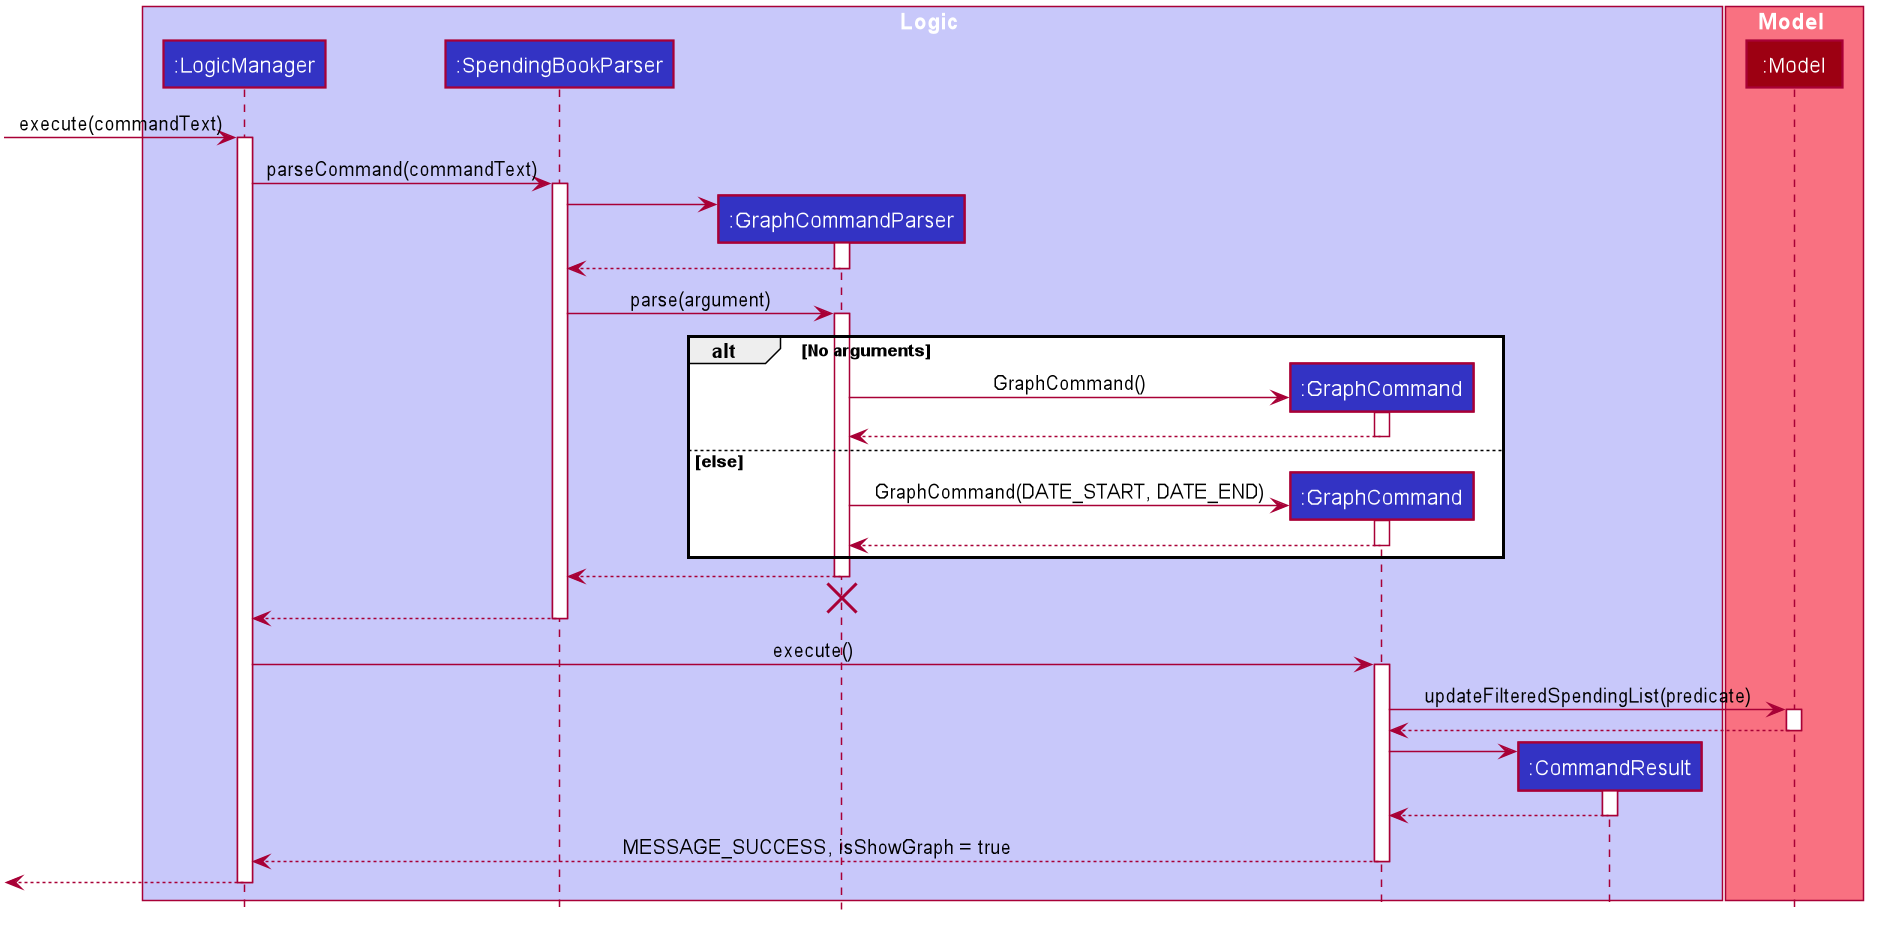
The lifeline for GraphCommandParser should end at the destroy marker (X) but due to a limitation of PlantUML, the lifeline reaches the end of diagram.
|
-
User first enters a
graphcommand. -
SpendingBookParserwill parse and identify the command as aGraphCommandand pass on the argument toGraphCommandParser. -
If no arguments were provided by the user,
GraphCommand#GraphCommand()is called to create a GraphCommand with no parameters. Otherwise,GraphCommandParserwill verify whether the arguments provided were valid.-
If they are valid,
GraphCommand#GraphCommand(DATE_START, DATE_END)is called to create aGraphCommandwith the specified parameters. -
Else, a
ParseExceptionwill be thrown and an error message will be shown to the user.
-
-
GraphCommandis returned toLogicManagerwhich then callsGraphCommand#execute(). -
Model#updateFilteredSpendingList(predicate)is subsequently called to update the list.
Execution
In the execution phase, the program processes and retrieves the data to be displayed and finally displaying it. Below is the UML sequence diagram and a step-by-step explanation.

-
Upon checking that the boolean
isShowGraph= true, theMainWindowcallsLogicManager#getGraphData(). -
LogicManagerthen gets the filtered list by callingModel#getStatsList, which returns an unmodifiableObservableList, containing only spending within the specified date range. -
LogicManager#getGraphData()then processes the spending and organise the data into aLinkedHashMap<String, Double>where the key value pairs represents date and cost respectively. -
Finally, the
graphDatais returned to theMainWindow. The data will be displayed on the Ui throughGraphPanel#loadData(graphData)call.
Design Considerations
| Aspect | Alternative 1 (Current choice) | Alternative 2 |
|---|---|---|
Whether to merge Graph and Statistics features into one command |
Distinct commands for Graph and Statistics features. |
Merge Graph and Statistics features into one command. |